
A cross-country study found that formal manufacturing firms in low- and middle-income countries operated, on average, at only 67% of the resource-allocation efficiency observed in the United States. When researchers simulated a better distribution of existing labour, capital, and other inputs, manufacturing productivity rose by an average of 62%, without adding technology, capital, or workers. The study's findings point to a useful operational truth: performance can improve when resources move to better uses, even when the resource pool stays exactly the same.
That principle applies inside a software company, agency, sales team, or operations department. Resource allocation efficiency isn't about keeping every person busy. It's about placing each hour, dollar, skill, and decision in the work with the highest marginal value, while preserving enough flexibility to respond when the forecast changes.
The Quiet Reason Busy Teams Miss Their Numbers
Two years after launching a services startup, a founder studies the operating dashboard late on a Friday. Every sprint is full. Retainers are staffed. Delivery managers report healthy capacity. No team has raised a formal resourcing concern.
Revenue is still behind plan.
The first reactions are predictable. Someone argues for hiring because the team looks overloaded. Someone else proposes cutting headcount because the output doesn't justify the cost. Both reactions may be wrong. The business might have enough people, but the wrong people are spending time on the wrong work.
A senior engineer is clearing routine tickets while a newer engineer struggles with an architectural problem. A strategist is polishing an internal presentation while a high-value client proposal waits for specialist input. A sales manager is supporting low-probability opportunities because the CRM treats every active deal as equally important. The calendars look full, yet the company isn't converting effort into enough value.
The useful question isn't “How busy is the team?” It's “What result is the next unit of effort most likely to create?”
This distinction changes the diagnosis. Utilization measures occupied time. Headcount measures available capacity. Revenue measures the final outcome, often too late to reveal where the allocation went wrong. Resource allocation efficiency sits between those measures, showing whether the business has directed its existing resources toward their strongest productive uses.
A practical review starts by mapping work, not by defending departments. Managers can list the major initiatives, the people assigned to them, the hours consumed, and the outcome each initiative is expected to produce. That exercise often exposes a familiar pattern: low-value work has permanent staffing, while high-value work depends on borrowed attention.
The fix doesn't begin with more effort. It begins with a shared view of marginal contribution, opportunity cost, and the speed at which resources can move. Once those measures are visible, hiring, outsourcing, cancellation, and reprioritization become operating decisions rather than emotional reactions to a disappointing dashboard.
What Resource Allocation Efficiency Actually Means
Resource allocation efficiency describes how effectively an organization places its available resources in the uses that produce the greatest additional output or value. The resources might be labour, capital, engineering time, advertising spend, sales capacity, or leadership attention.
Three ideas often get blended together:
- Utilization asks whether a resource is occupied.
- Productivity asks how much output a resource creates.
- Allocation efficiency asks whether the resource is working on the opportunity where its next unit of effort creates the most value.
A team can have high utilization and weak allocation efficiency. An engineer who spends every available hour on low-impact maintenance is busy, but the company may lose more value by keeping that engineer away from a product constraint. Similarly, a marketing budget can be fully spent while being distributed across channels that produce very different strategic returns.
The productivity-covariance lens
Economists often examine whether more productive firms receive a proportionately larger share of resources. The OECD analysis of resource allocation describes this relationship through the Olley–Pakes decomposition. In plain language, aggregate productivity improves when productive units hold more of the labour and capital, rather than when every unit receives an equal share.
Consider two engineers with different strengths. If both receive identical ticket queues, the stronger engineer may spend time on straightforward fixes while the other gets blocked by complex work. A better allocation routes the difficult architectural tasks to the engineer with the highest marginal output, while the other handles suitable work and develops the skills needed for more demanding assignments. Equal distribution feels fair, but it isn't automatically efficient.
This doesn't mean the strongest employee should receive every important task. That approach creates dependency, burnout, and a fragile operating model. It means managers should compare the expected value of the next hour in each possible assignment, then account for learning, resilience, quality, and future capability.
For teams building a practical system, guidance on how to optimize resources with MakeAutomation can help translate the idea into workflows and decision rules. Internal performance data still matters more than any template. A useful allocation review also benefits from connecting resource choices to sales pipeline metrics, because pipeline quality reveals whether commercial effort is reaching opportunities with enough potential.
The Four KPIs That Reveal Misallocation
Revenue and headcount are lagging indicators. They tell managers what happened, but rarely show which allocation decision caused it. Four operational KPIs expose the mismatch earlier.
Weighted versus unweighted productivity
Unweighted productivity treats every unit of labour as interchangeable. Weighted productivity reflects the cost, skill, scarcity, or strategic importance of the resource. A team that assigns expensive senior hours to routine work can look productive in raw output while creating weak returns after the labour mix is considered.
Managers can compare output per person with output per cost-weighted unit of labour. If the unweighted figure looks stable while the weighted figure deteriorates, senior capacity may be doing work that a less expensive or more available resource could handle.
Output per resource
This KPI divides a defined result by the resource consumed. The result might be qualified opportunities per sales hour, completed releases per engineering week, or retained accounts per customer-success hour. The definition must stay consistent, otherwise teams will optimise the reporting method instead of the work.
The useful comparison is across projects, teams, skills, and channels. A large gap doesn't automatically justify moving resources. It does identify where managers should investigate quality, constraints, demand, and hidden dependencies.
Time to reallocate
Time to reallocate measures the interval between detecting a poor allocation and moving people, budget, or attention. Many companies measure forecast accuracy but don't measure how long it takes to act on a forecast.
A slow cycle turns a small misallocation into a recurring cost. Managers should record when a constraint is identified, when a decision is approved, when the change reaches the team, and when the result is checked. The measure belongs to the operating system, not to one department.
Value-density of work
Value-density compares the strategic or commercial contribution of an initiative with the effort invested. It doesn't require false precision. Teams can use a consistent scoring model based on customer impact, revenue potential, risk reduction, learning value, or capability creation.
A campaign with impressive activity but little pipeline contribution may deserve less attention than a smaller experiment that clarifies a valuable market. For a deeper view of this type of assessment, managers can use campaign performance analysis to connect activity with outcomes instead of rewarding volume alone.
| KPI | What It Measures | Decision It Changes |
|---|---|---|
| Weighted versus unweighted productivity | Whether expensive or scarce capacity is producing appropriate value | Move senior specialists away from routine work when the weighted result shows a drag |
| Output per resource | The result created by a defined unit of labour, capital, or attention | Compare teams, projects, and channels before adding capacity |
| Time to reallocate | How quickly the organization turns a decision into a new assignment | Remove approval steps that leave known constraints unresolved |
| Value-density of work | Strategic contribution relative to effort invested | Stop, narrow, or redesign initiatives that consume attention without enough return |
A KPI becomes useful only when it changes a decision. If a dashboard merely describes the past, it hasn't improved allocation efficiency.
Why High Utilization Can Make Things Worse
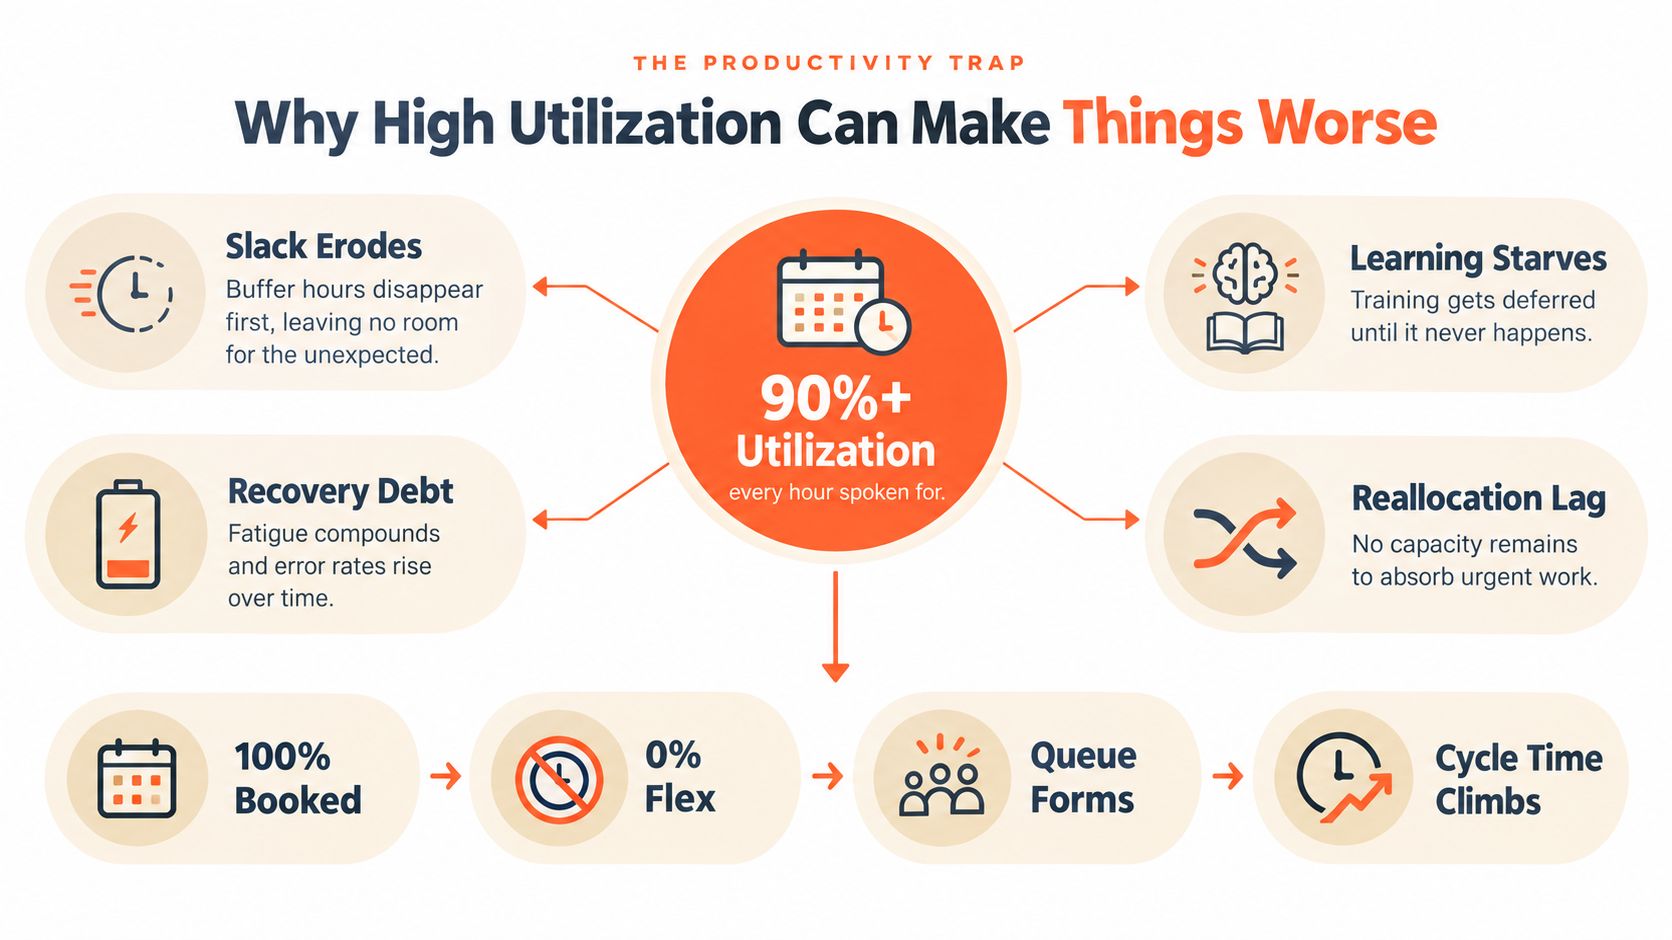
A fully occupied calendar can hide an operational weakness. When every hour is assigned, managers lose the spare capacity needed to absorb urgent work, investigate a new opportunity, train a teammate, or recover from an incorrect forecast.
The problem isn't that busy teams lack discipline. The problem is that a tightly packed system has no room to correct itself. A poor allocation can continue through an entire delivery cycle because no one has enough available capacity to move into the work that now matters more.
Slack is an operating asset
Slack isn't automatically waste. For knowledge teams, it can support discovery, documentation, skill development, and rapid response. For execution-heavy teams, it can absorb variance in demand and prevent a small delay from blocking every downstream task.
The right amount depends on demand volatility, work interdependence, service-level commitments, and the cost of interruption. A team handling stable, repeatable work may need less reserve than a product group operating under uncertain requirements. Managers should protect capacity when it provides a real option to respond, not because empty calendars look virtuous.
Research on AI-based cloud allocation reinforces the need to measure more than utilization. A review of 63 studies reported average reductions of approximately 45% in latency, 32% in cost, and 35% in energy use across different subsets of studies, with wide ranges across the underlying research. The review recommends treating allocation as a multi-objective problem involving cost, latency, throughput, service-level failures, energy, and utilization.
The same logic applies to human teams. A manager should ask:
- Protect reserve capacity: Can spare time absorb demand shocks, experiments, incidents, or cross-training?
- Investigate idle capacity: Does the team lack demand, lack a clear mandate, or lack the skill needed for available work?
- Test the constraint: Would moving capacity elsewhere create more value than filling the current calendar?
- Review the trade-off: Is the reserve producing resilience, or is it merely hiding weak planning?
A resource that is available for a valuable change is not idle in the same way as a resource with no credible work.
The Six Bottlenecks That Block Reallocation
Most allocation failures have a recognizable cause. The challenge is finding the constraint before a company launches a broad planning transformation.
The wrong headline metric
A team that celebrates utilization may assign more work without checking value. A team that celebrates activity may reward volume over outcomes. The diagnostic is simple: if the primary metric rises while customer value, quality, or strategic progress stays flat, the organization is measuring motion rather than contribution.
The first move is to pair the headline metric with an outcome measure. Utilization can sit beside value-density, output per resource, or service quality.
Slow reallocation cycles
A monthly or quarterly allocation process struggles when demand changes faster than the planning rhythm. Requests wait for a meeting, then an approval, then a staffing change. By the time the move happens, the original constraint may have disappeared.
The first move is to measure the full cycle from detection to verified result. Trigger-based reviews can handle urgent changes, while scheduled reviews preserve strategic discipline.
Internal politics
Pet projects often retain people and budget because cancellation feels like admitting failure. Leaders may protect a familiar initiative even when another project has clearer evidence of value.
The diagnostic is resource persistence without outcome improvement. The first move is to require every initiative to state its next decision point, expected contribution, and conditions for receiving more capacity.
Compliance and approval drag
Some allocation decisions need legal, security, financial, or regulatory review. That protection matters, but unclear ownership can turn a sensible safeguard into a permanent queue.
The first move is to separate decisions that need formal approval from reversible experiments. Low-risk changes should have a clear owner and a defined escalation path.
Forecasting failure
A forecast can create misallocation before work begins. Teams reserve capacity for demand that never arrives, hire for a speculative pipeline, or commit specialists before customer requirements become clear.
The first move is to distinguish committed demand from probable demand and exploratory demand. Managers should review the confidence behind each category rather than treating every forecast line as equally real.
Tool fragmentation
Capacity data often sits across a project tracker, CRM, finance system, HR platform, spreadsheets, and chat. Each tool may be accurate within its own boundary while the combined picture remains unusable.
The first move is to define one allocation record, one owner for its quality, and a small set of fields that every system can share. More software won't repair missing definitions.
| Bottleneck | Telltale Sign | First Move to Diagnose |
|---|---|---|
| Wrong headline metric | Activity rises without a matching outcome | Pair utilization with value and quality measures |
| Slow reallocation | Approved changes arrive after the constraint has shifted | Track detection, approval, deployment, and verification |
| Internal politics | Low-return initiatives retain resources by default | Set explicit continuation and cancellation criteria |
| Compliance drag | Routine changes wait in the same queue as high-risk decisions | Classify reversible and irreversible decisions |
| Forecasting failure | Teams commit resources before demand becomes credible | Separate committed, probable, and exploratory demand |
| Tool fragmentation | Managers reconcile conflicting capacity views manually | Establish a shared allocation record and data owner |
Choosing the Right Operating Model for Your Function
Resource allocation efficiency includes deciding where the work should live, not only who should perform it. Four operating models cover most choices.
An in-house team offers institutional knowledge, closer feedback, and stronger control over a core capability. The trade-off is fixed capacity, hiring risk, management overhead, and the possibility that specialists become trapped in low-value maintenance.
An agency can launch a capability without a long hiring process. It may bring tested processes and broader experience, but handoffs, context transfer, and competing client priorities can reduce responsiveness. The model works best when an outside team can deliver a defined outcome without needing constant internal interpretation.
Specialist software scales a repeatable process and can improve visibility across projects. It doesn't remove the operating burden. Someone still needs to configure the system, maintain data quality, interpret recommendations, and resolve exceptions.
A done-for-you service sits between software and an agency. It can reduce the client's operating load while retaining a specialized delivery process. The buyer trades some margin and control for speed, consistency, and less internal coordination.
| Model | Time-to-Launch | Cost Profile | Buyer's Burden |
|---|---|---|---|
| In-house team | Slower while hiring and onboarding | Fixed payroll and management cost | High, including hiring, coaching, and process ownership |
| Agency | Faster when the brief is clear | Variable external fees and coordination cost | Medium, with emphasis on briefing and quality control |
| Specialist software | Fast for standard workflows | Subscription cost plus implementation effort | Medium to high, depending on internal operators |
| Done-for-you service | Fast when the provider owns execution | Recurring service cost tied to delivery | Lower, with oversight focused on outcomes and decisions |
The choice should follow the constraint. A core capability with deep domain knowledge may belong in-house. Variable work with uncertain demand may suit an external provider. A repeatable process with strong internal ownership may justify software. A regulated function may need tighter control regardless of the model.
Teams assessing automation can use guidance on how to build a scalable automation strategy before selecting a tool or provider. Commercial teams can also compare the operating requirements of different B2B sales tools, especially when the constraint is execution capacity rather than software access.
A 30-60-90 Day Plan to Lift Allocation Efficiency
A useful rollout starts with measurement and earns the right to automate later. The process should be small enough to run inside an existing team, but explicit enough to expose trade-offs.
Instrument the current system
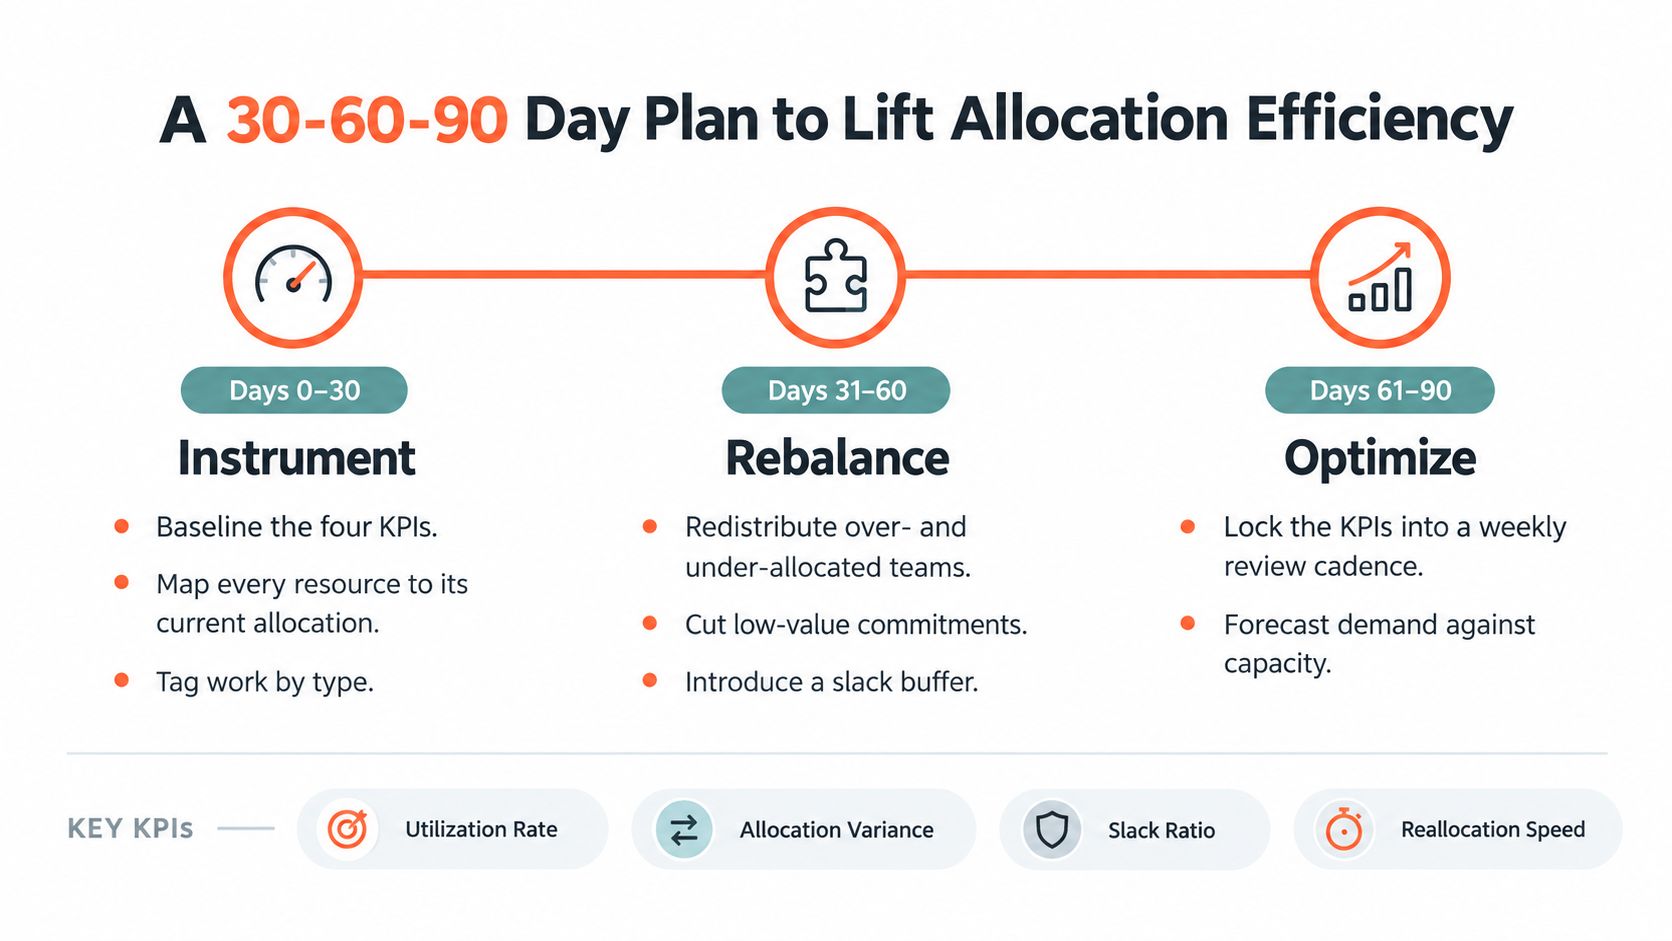
The first phase maps every resource to its current allocation. Managers record the work being done, the expected outcome, the skill involved, and the cost or scarcity of the capacity. Each initiative receives a consistent value-density tag, even if the first version relies on a simple qualitative scale.
The four core measures are then baselined:
- Weighted versus unweighted productivity: Does the labour mix match the value of the work?
- Output per resource: Which assignments produce stronger results from comparable inputs?
- Time to reallocate: How long does a valid change take to reach execution?
- Value-density: Which initiatives justify their claim on scarce attention?
Rebalance through controlled pilots
The second phase tests the model with one or two teams rather than imposing it across the company. Managers select an allocation problem, move capacity toward a higher-value use, and record the decision rule that triggered the move.
A pilot should also include work that gets stopped or deferred. Without subtraction, reallocation becomes an additional priority layered on top of the old workload. The team measures output, quality, reallocation speed, and the effect of the new reserve capacity.
Standardize what survives
The final phase turns successful decisions into operating rules. Tactical allocation reviews can occur weekly when demand and constraints change quickly. Strategic allocation reviews can occur quarterly, with a separate process for urgent triggers.
Each KPI needs an owner, a definition, a data source, and a decision attached to it. The review should end with a clear action, such as shifting a specialist, cancelling an initiative, protecting reserve capacity, or improving a forecast input.
A measurement system earns credibility when it changes resource placement, not when it produces a more impressive dashboard.
What Most Guides Still Get Wrong
Many guides frame allocation as a budgeting exercise. That encourages leaders to protect headcount, departments, or project funding instead of asking where the next unit of effort can create the most value.
They also treat utilization as an uncomplicated virtue. The evidence on dynamic allocation shows why that's incomplete: an effective system balances cost, speed, service quality, energy, and other objectives rather than maximising one rate. Human teams need the same discipline. A full calendar isn't proof of efficiency if it prevents learning, recovery, or fast movement toward a better opportunity.
AI changes the trade-off, but it doesn't remove it. Predictive systems can reduce decision time and improve recommendations, yet weak data can make incorrect priorities move faster. Managers still need review gates, reversible experiments, escalation rules, and outcome checks. Automation compresses the planning cycle; it doesn't decide which outcome deserves protection.
Outsourcing tends to fit variable, reversible work where speed matters more than accumulated domain knowledge. Hiring tends to fit stable work that sits close to the company's moat and benefits from deep institutional context. Neither is universally efficient.
A defensible cadence combines weekly tactical reviews with quarterly strategic reviews, while allowing urgent triggers between them. That rhythm gives teams a regular place to correct allocation without turning every change into a political event.
Eludic helps B2B companies turn outbound capacity into qualified pipeline without building and managing an internal SDR operation. Its team handles campaign infrastructure, research, copy, deliverability, replies, and meeting coordination, so teams can visit Eludic to see whether a done-for-you model fits their allocation constraints.